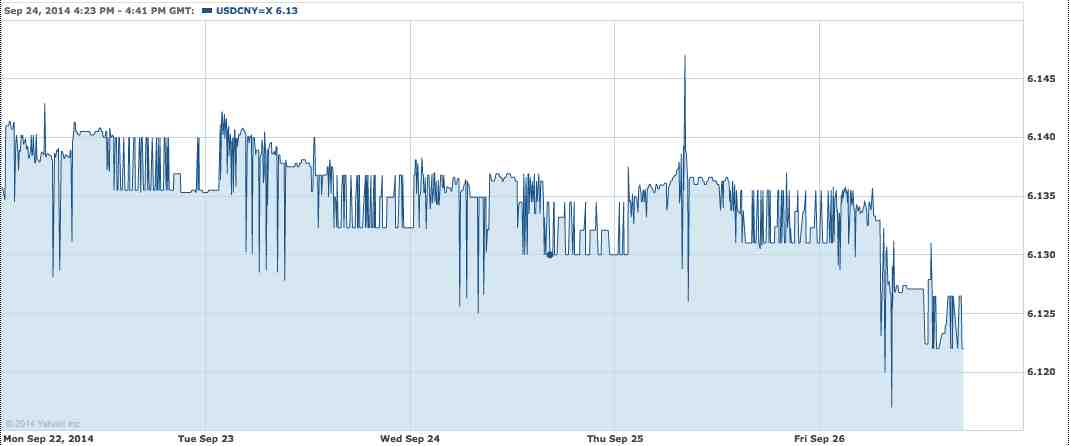
For your reference here are versions of the forex graphs I showed in class today. I put in (i) a log scale alongside the absolute scale for the US nominal exchange rate, (ii) the index of the nominal and real [CPI-adjusted] BIS trade-weighted exchange rate (plus the bilateral yen, euro and US$ rates). You can see the difference between (iii) the managed peg for the RMB vs the US$ (with a maximum trading band each day) and (iv) the “random walk” movement of the free-floating yen. ( Click to expand. Thanks to Yahoo! Finance for the short-term yen and RMB graphs.)

|

|
 . . |

|