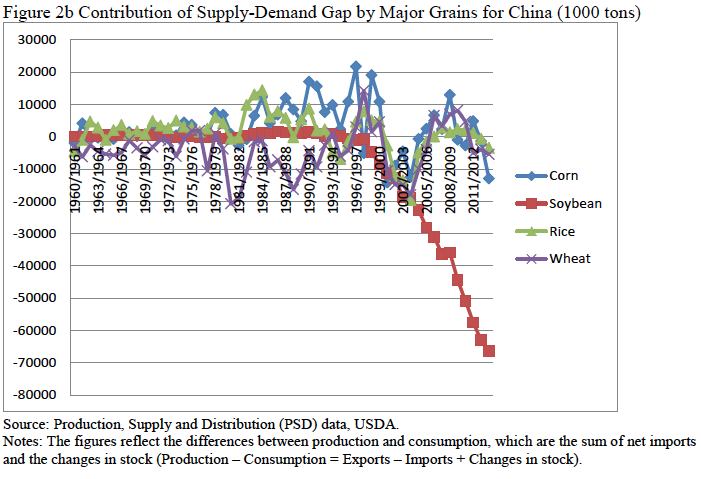
Fukase & Martin published a nice World Bank discussion paper, Who Will Feed China? (June 2014). In it they attempt to model food demand and food supply using cross-country data to establish a baseline. In line with my claim that the Engel’s coefficient (food as a share of household expenditures) is stable across societies, they find a fairly good fit. They then use this to look at likely trends in food supply and food demand, and find that China will not likely see a huge increase in food imports, though at the commodity level that varies more. (For example, China already depends on imports of soybeans.)
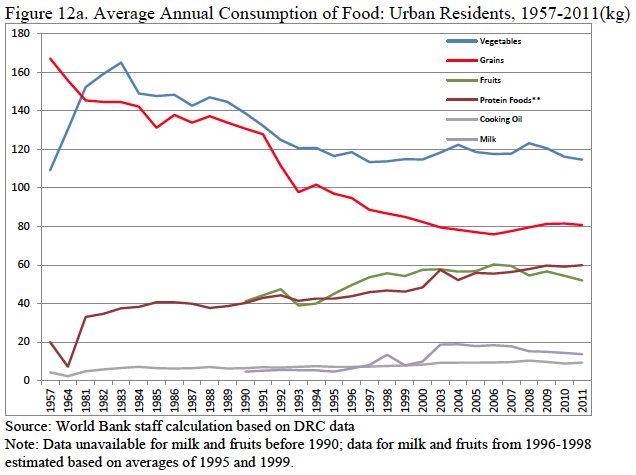
One reason is that, as outlined in class, demand is not income elastic at China’s current income level. There are however shifts across types of food. For example, even rural Chinese have decreased their consumption of grains (= rice) by 25% over the past decade. The change in rural diets — see the graph — is even more dramatic, with grains down by half and meat tripling. In contrast consumption of meat is far higher, and beef in particular has a high opportunity cost in grain-equivalent. Cattle don’t turn food into meat very efficiently (compared to chickens and particularly fish), the amount of meat versus non-edible components (the “dressage” ratio) is lower than for (say) chicken, and you need a large inventory relative to the amount being eaten because a cow only has a calf infrequently, and they require a year-plus of growth to mature. So a rise in beef leads to a disproportionate use of land, directly for grazing and indirectly to grow grain for feed instead of for human consumption. Cattle eat up a lot of land. Urbanization also eats up land. On the other side, China continues to see productivity increases.
 The net is that despite the shift in diet towards more land-intensive foods, overall supply remains high relative to overall demand, helped because demand is at or near its peak in land- and grain-equivalent terms.
Look through the paper for details. Aside from the discussion of robustness checks of their empirical model, it’s in general not technical, and the color graphs at the end are fascinating.
BTW the US Engle’s coefficient is 8.3% for food at home and 5.7% for food away from home or 14% overall. In 2012 that for urban China was 36%, so food prices are a salient political issue. Note however that in 1978 it was 58% [and still 55% in 1989, the year of Tiananmen]. In rural areas, which were (and remain) systematically poorer, it was 68% in 1978 but “only” 39% in 2012. (It’s easy to look up such data: go to “People’s Living Conditions” on the China Statistical Yearbook web site, found on the Econ274 Links list at right.)
By the prof posting as a class member